In a typical CRM system, there might be huge quantities of data (like case items) that we would want to gain insight into. In the first part of a two part series, I will focus on using PowerPivot to connect to a CRM system, extract data, and present the data in powerful new ways using Excel.
PowerPivot is a powerful data mashup and data exploration tool based on xVelocity in-memory technologies providing unmatched analytical performance. The goal of PowerPivot is to empower users of all levels with new insights through familiar tools, which in this case is Excel.
PowerPivot for Excel includes a wizard that you can use to import data from different sources, ranging from large databases, to public data feeds, to spreadsheets and text files stored locally on your computer. The PowerPivot data can further be enriched by creating relationships between the tables in the PowerPivot window. And because PowerPivot data is Excel, it is immediately available to PivotTables, PivotCharts, and other features in Excel that users use to aggregate and interact with data. PowerPivot supports files up to 2GB in size and enables you to work with up to 4GB of data in memory.
In addition to the graphical tools that helps analyze data, PowerPivot includes DataAnalysis Expressions (DAX), which is a new formula language to extend data manipulation capabilities of Excel.
Install PowerPivot:
InstallPowerPivot from the Microsoft Download Center. Depending on your Office version, download either the 32 bit or 64 bit version of PowerPivot for Excel 2010. After successful installation, you will see a PowerPivot tab on the Excel ribbon.
Connect to CRM data source:
In our example I am going to connect to the CRM instance using the data feed option in PowerPivot. For that, first we need the value of the CRM ODATA url.

2. Open Excel 2010, click on PowerPivot tab and select the PowerPivot Window button.

3. In the PowerPivot window, choose "From Data Feeds" button. In the table import wizard, provide a name for the connection, and enter the organization data service url from step 1.

4. Select the Advanced button in the table import wizard. Under section security, set the following values (for an on premise CRM 2011 install):
a. Integrated Security: Basic
b. User Id: <domain>\<userId>
c. Password: <password>

5. Select Ok in the "SetAdvanced Properties" window. Click "Next" in the table import wizard.
6. In the "Select Tables and Views" dialog window, choose AccountSet, ContactSet and IncidentSet items. Click on Finish button.

7. Once the data from the 3 entities has been successfully imported, close the table import wizard.

Create PowerPivot Chart:
Now that we have the data from CRM, lets us create a PivotChart to show the cases by Customer, with the ability to filter dynamically on city (from account entity) and case priority.
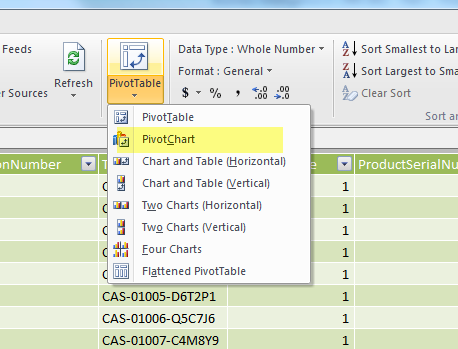
1. In the PowerPivot for Excel window, select from the ribbon PivotTable/ PivotChart. Create the PivotChart in the existing worksheet.
2. On the right, under PowerPivot Field list, you will see the 3 data views (AccountSet, ContactSet and IncidentSet) imported from CRM.

3. Expand IncidentSet and select CustomerId_Name and PriorityCode_Value. A chart like the screenshot below is rendered.

4. Drag and drop PriorityCode_Value into Legend Fields (series) box.

5. Under AccountSet, drag and drop Address1_City under Slicers Horizontal (If you are prompted to create a relationship, do so, and let Excel create it for you)

6. Under IncidentSet, drag and drop PriorityCode_Value under Slicers Vertical

Once the PowerPivot Chart has been created, you can select to see the cases from a particular city, or cases marked as high priority, or both. For example, in the screenshot below, I have selected cases whose customers are in Renton, and only the ones marked Priority 1 or 2.

Conclusion:
While the data set we are using in our example is pretty small, the opportunities to use this approach to get insight into huge reams of data are immense. The approach is also to use tools like Excel that people know and use regularly at work, rather than force Business Analysts to learn coding or write sql queries. The goal is to make Business Intelligence a self service operation, and PowerPivot is a great way to do it.
In the second part of this series, I will talk a little bit about taking this PowerPivot data and saving it to Sharepoint in order to use the PowerView tool. Hope to see you then!
